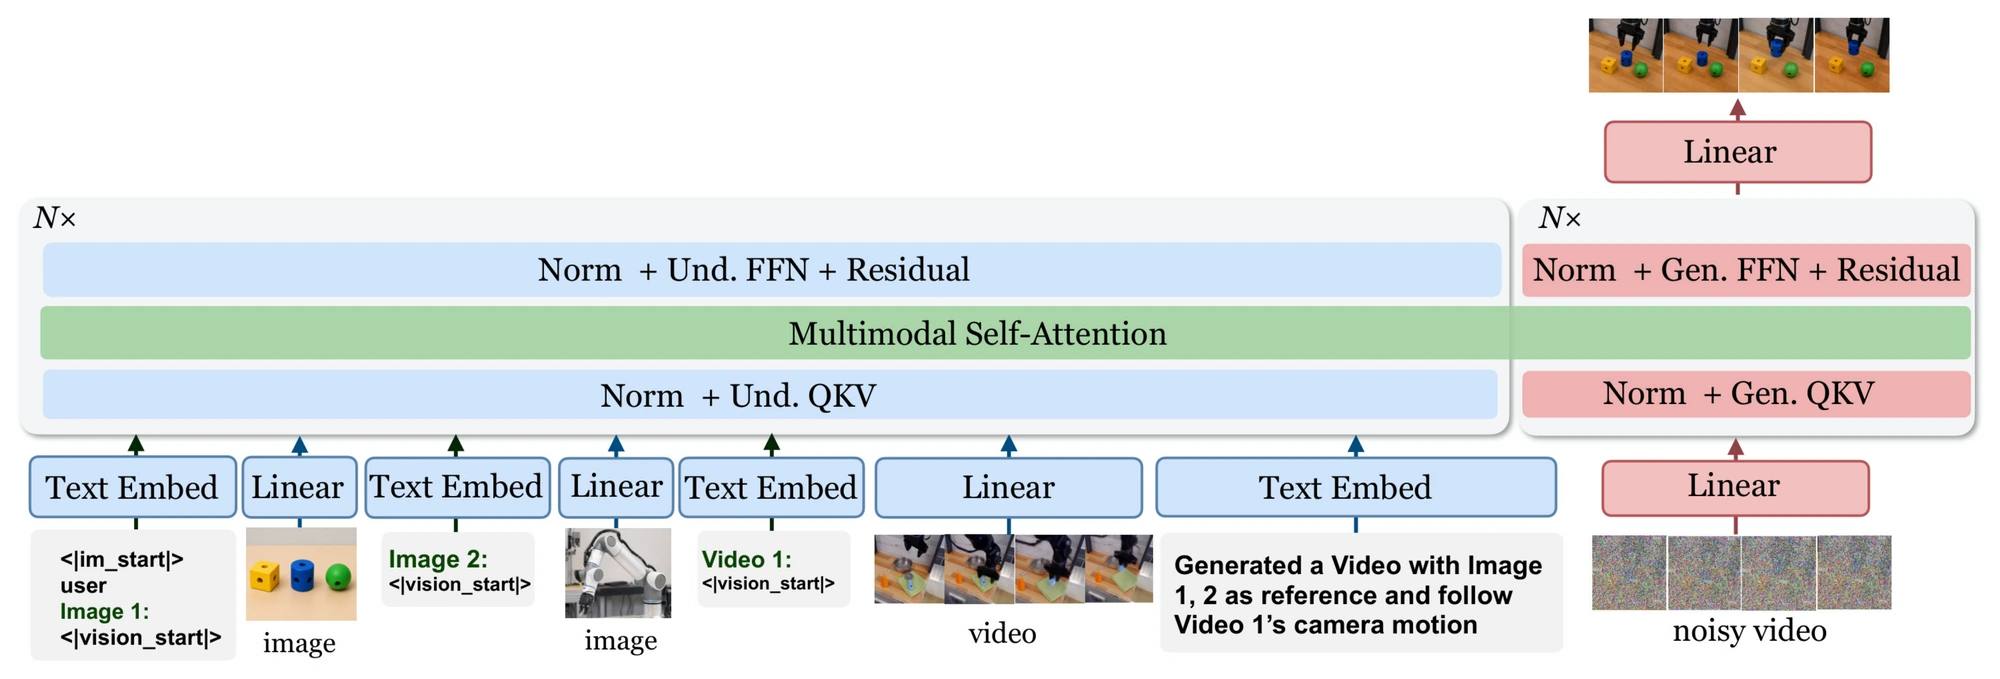
PixelUMM reads and writes raw pixels with a single decoder-only Transformer — no VAE and no vision encoder.
Images become 16×16 patches and videos become 4-frame tubes; a Qwen3-8B backbone with separate
understanding and generation experts shares one self-attention across text, clean pixels, and noisy pixels.
Architecture overview. The answer text shown for the understanding branch is illustrative.
Videos could not be loaded. Please reload the page.
Empirical findings
Eight experiment families · F1–F8
The ablations behind PixelUMM are grouped into eight experiment families, F1–F8, with configurations numbered R01, R02, and so on. We start with patch artifacts, the most visible failure mode of a linear pixel head.
F3
Patch artifacts
With the linear pixel decoder, generated images and videos can show faint grid-aligned intensity steps in smooth, low-texture regions such as sky. As also observed in MiniT2I, these patch artifacts become more pronounced at high classifier-free guidance, around CFG 6.
Linear pixel heads (F3-R01). Left: a generated image above a crop of its smooth sky. Right: frame 0 of the Upright piano video above a crop of the smooth wall behind the pianist. Open the figure to view it at full resolution.
Note that the released checkpoint, the benchmarked model and all online demos, including every video on this page, are generated with the default linear output heads, because switching from a linear to a convolutional head requires further training.
Three convolutional video heads
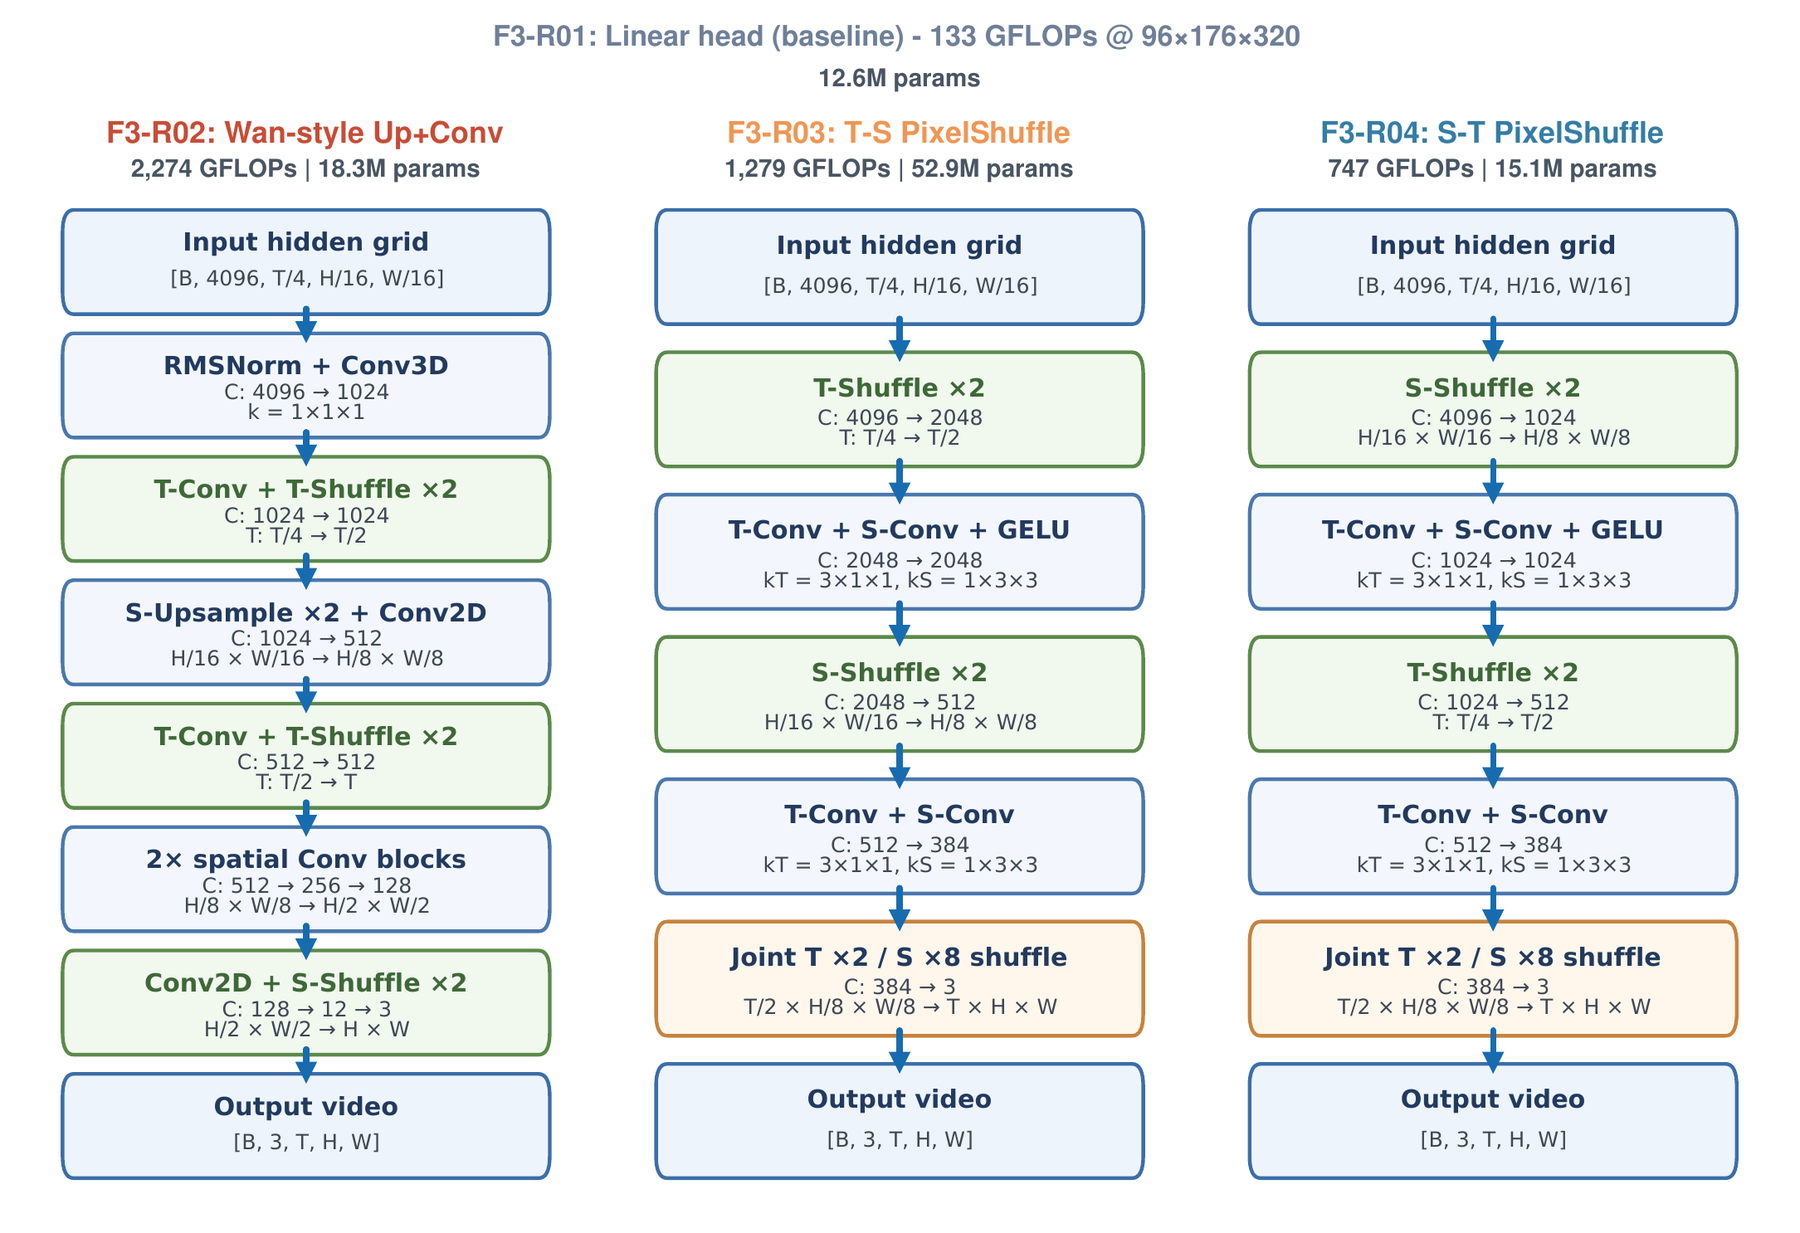
Each head replaces video_linear_outproj, is initialized from Gen Stage 1, and maps the Transformer’s T/4 × H/16 × W/16 hidden grid back to T × H × W RGB video.
Run
Output head
GFLOPs*
Params
F3-R01
Linear (baseline)
133
12.6M
F3-R02
Wan-style upsample + conv
2,274 (17.1×)
18.3M (1.5×)
F3-R03
PixelShuffle, temporal-first (T-S)
1,279 (9.6×)
52.9M (4.2×)
F3-R04
PixelShuffle, spatial-first (S-T)
747 (5.6×)
15.1M (1.2×)
*Convolution-only forward cost for one 96×176×320 clip.
The three convolutional output heads. T-Conv and S-Conv denote 3×1×1 temporal and 1×3×3 spatial convolutions.
What the heads trade off
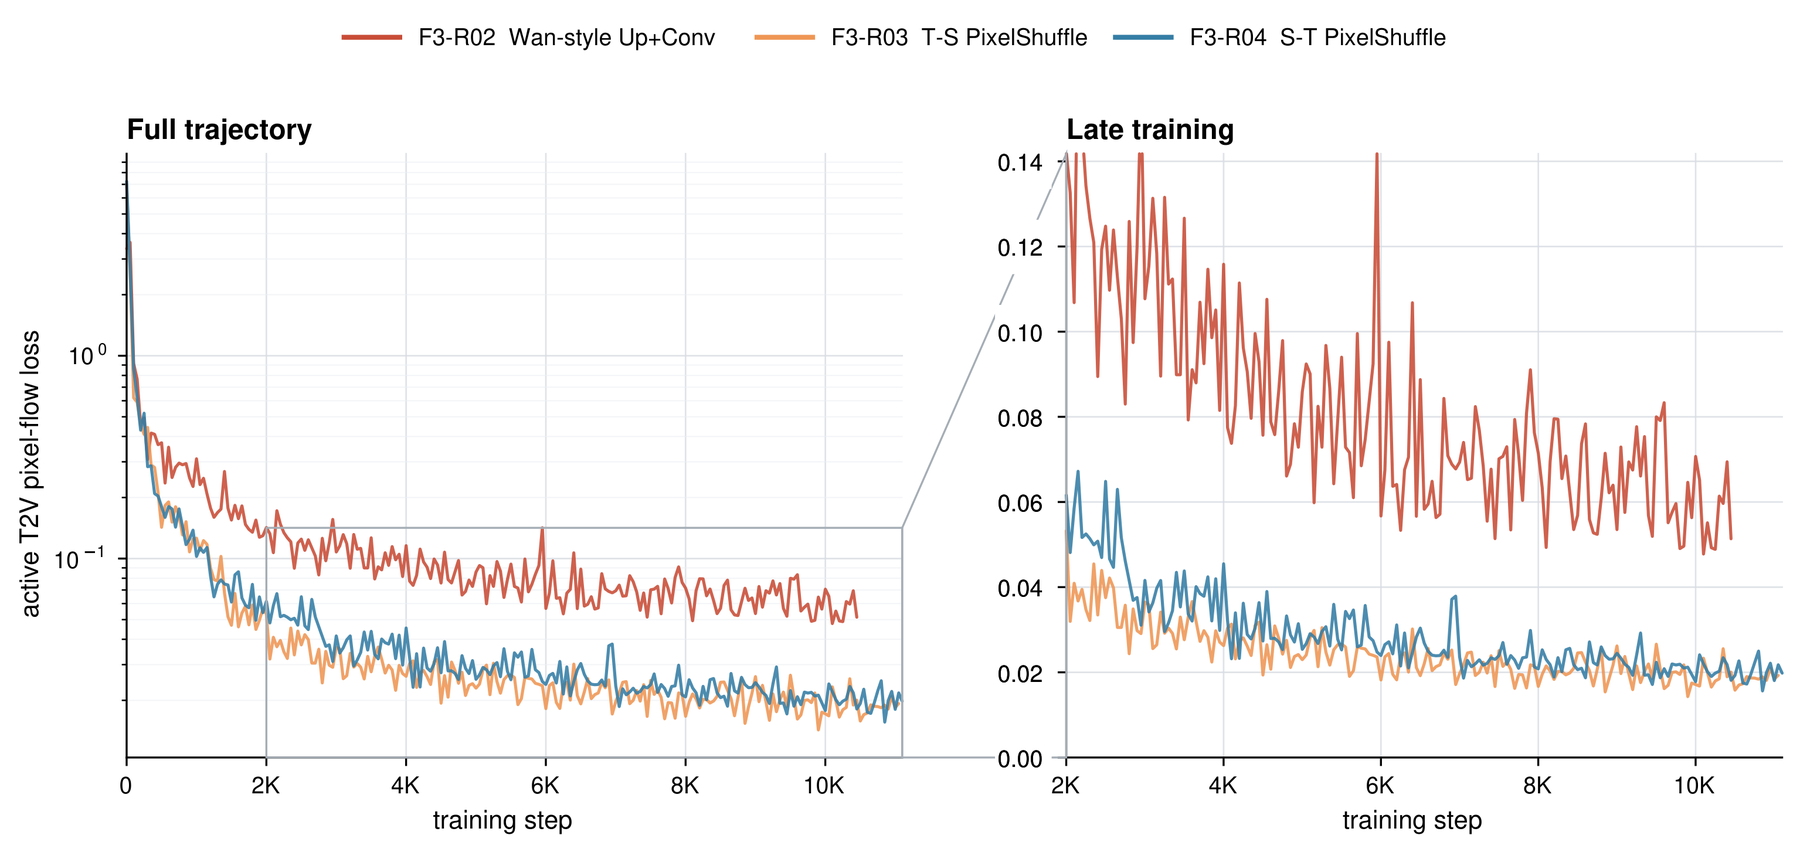
Training loss. Both PixelShuffle heads converge to a T2V pixel-flow loss near 0.02, while the Wan-style head stays above 0.05.
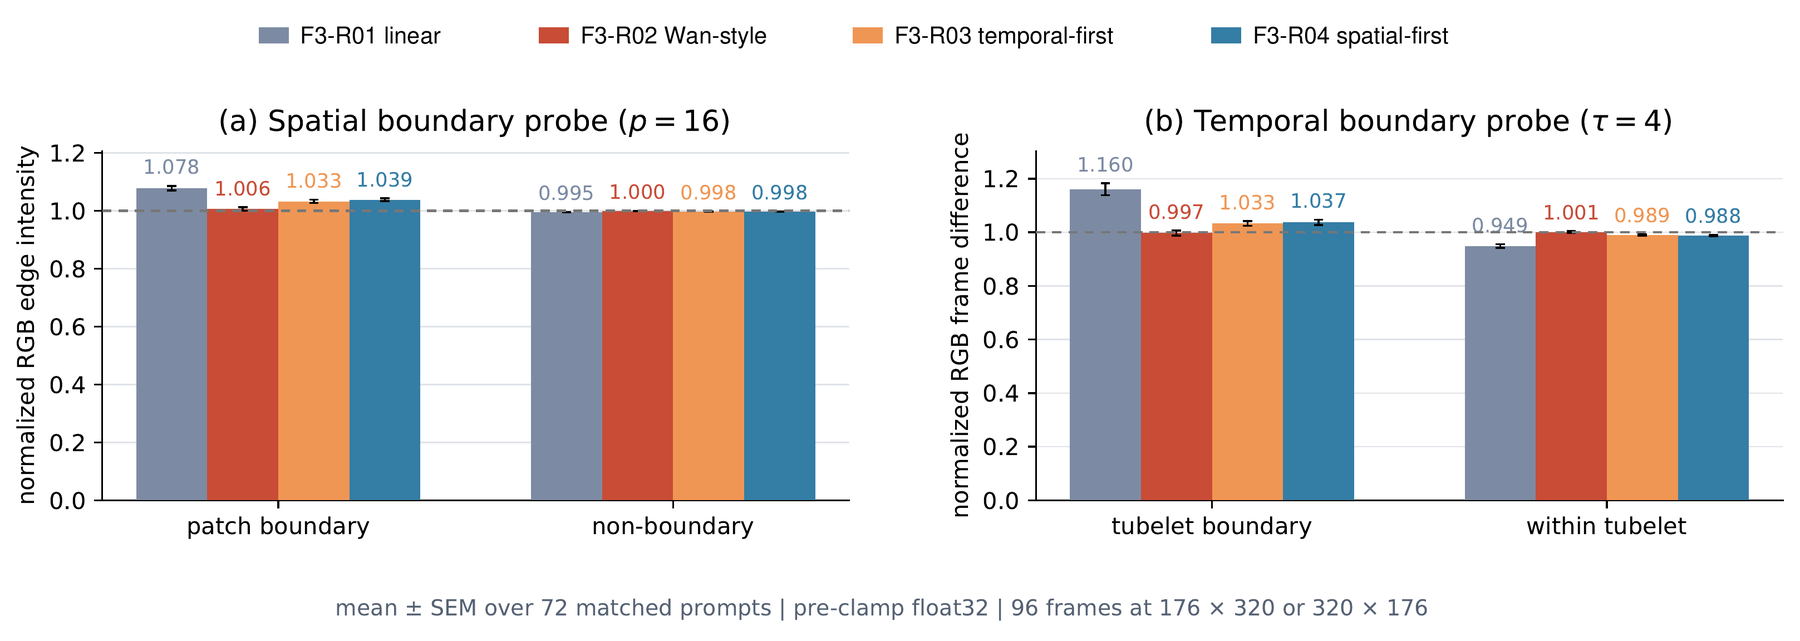
Boundary probe. Across 72 evaluation prompts, measured on pre-clamp float32 outputs, the linear head shows the largest elevations at 16-pixel patch boundaries (1.078) and 4-frame tubelet boundaries (1.160). The Wan-style head sits near the normalized baseline; the PixelShuffle heads leave smaller residual elevations.
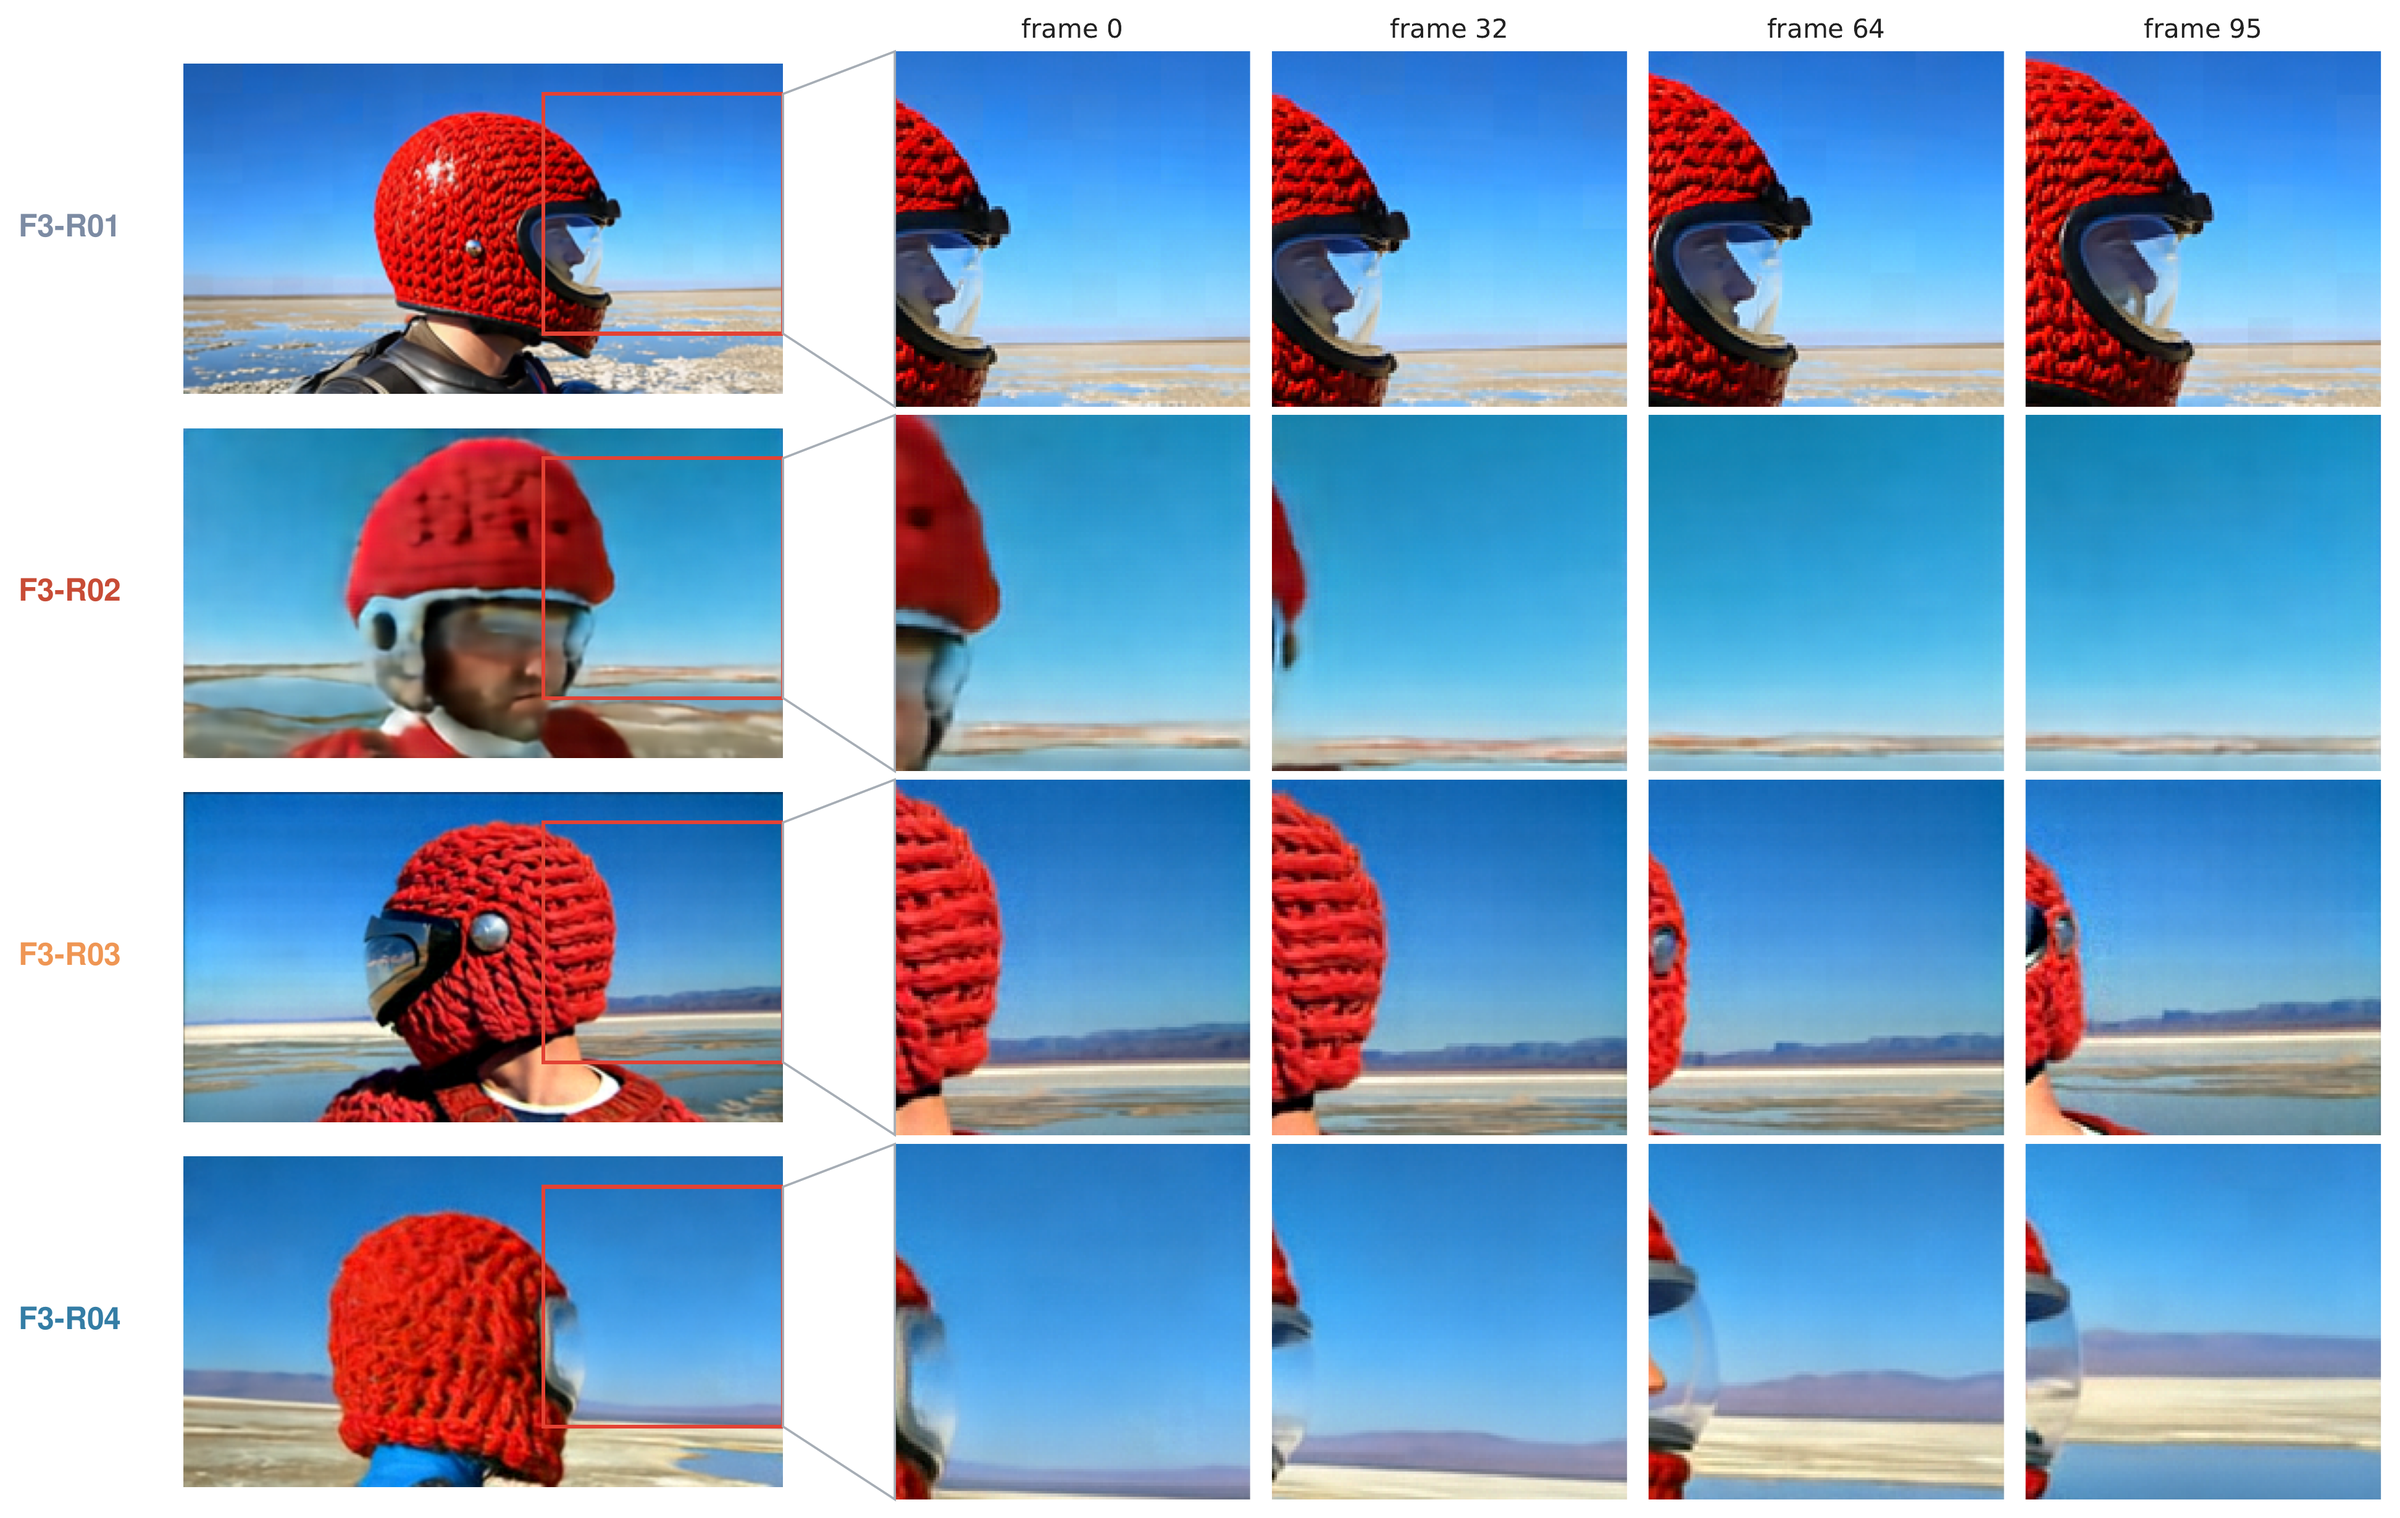
Generated video. The Wan-style head gives the cleanest boundaries but blurrier outputs. PixelShuffle offers the better trade-off, with temporal-first (F3-R03) slightly ahead of spatial-first (F3-R04).
Raw T2V pixel-flow loss for F3-R02, F3-R03 and F3-R04, without smoothing.Spatial (16-pixel) and temporal (4-frame) boundary probes; mean ± SEM over 72 prompts.
Same prompt, one row per output head. The red box marks a fixed crop, shown at frames 0, 32, 64 and 95 of the 96-frame video (lossless frames captured before video encoding).
TakeawayConvolutional heads reduce patch artifacts. PixelShuffle offers a better trade-off between training loss and artifact suppression than the upsampling-and-convolution head.
Note that the released checkpoint, the benchmarked model and all online demos, including every video on this page, are generated with the default linear output heads, because switching from a linear to a convolutional head requires further training.
F1
Image patch size
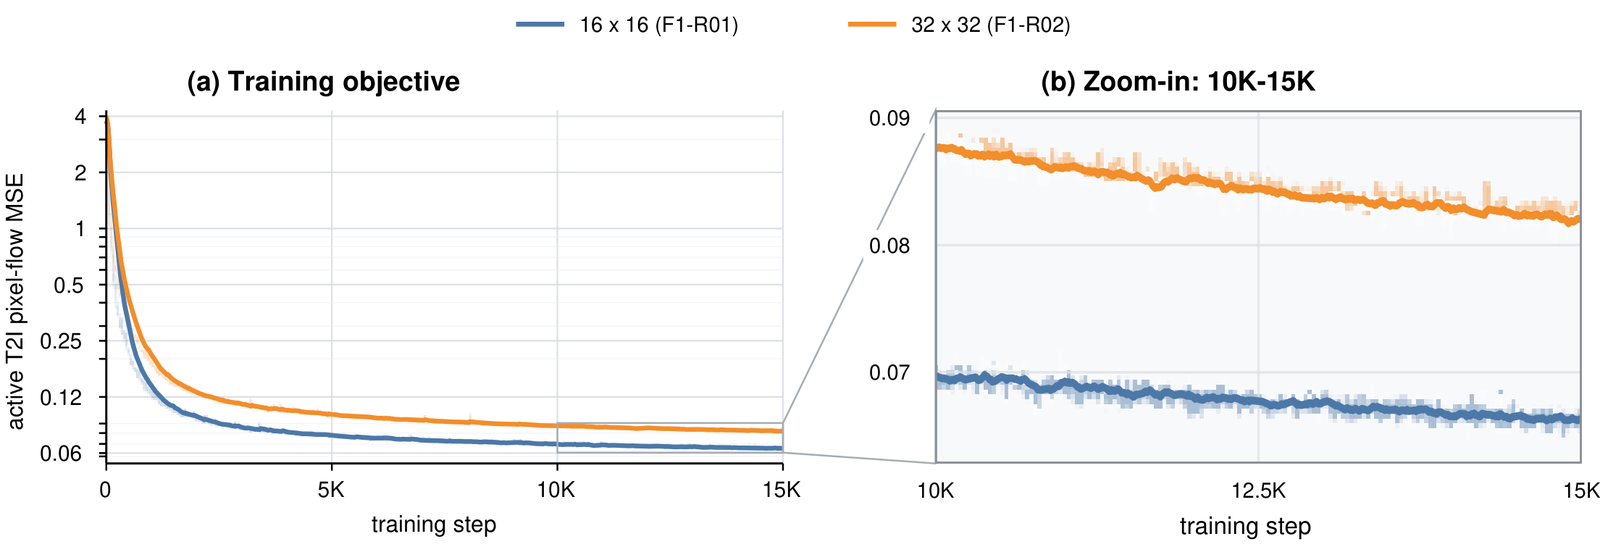
16×16 (F1-R01) and 32×32 (F1-R02) patches differ only in the generation input projection and output head. With the same sequence-length budget, 32×32 fits four times as many images per step, yet 16×16 keeps a lower T2I training loss throughout late training.
T2I pixel-flow MSE: full trajectory (left) and 10K–15K zoom-in (right).
TakeawayStronger spatial compression makes image generation harder to learn.
F2
Video patch size
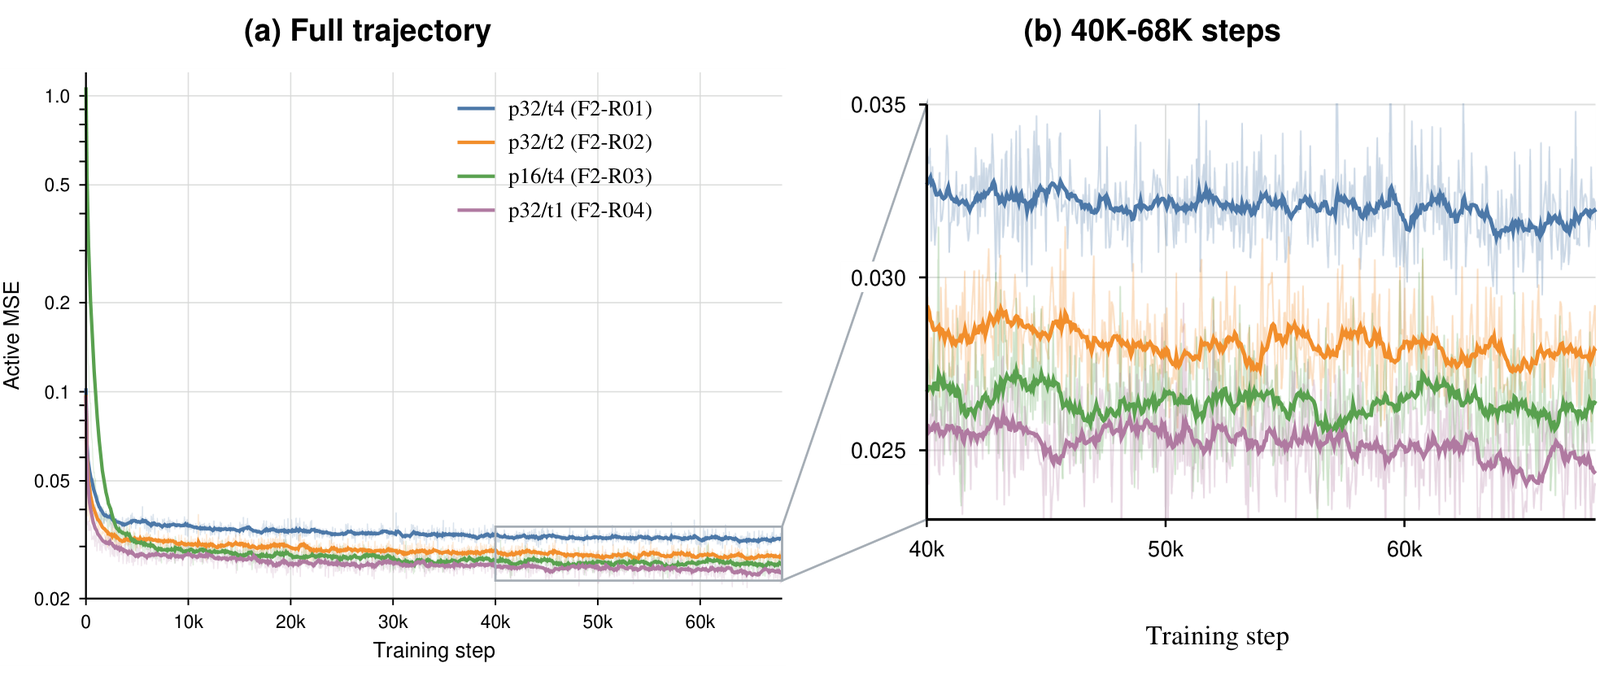
Four tubelet-to-token mappings: p32/t4, p32/t2, p16/t4 and p32/t1 (spatial patch / frames per token). Less aggressive spatiotemporal compression generally gives lower T2V loss, with p32/t1 the lowest. The final model uses p16/t4 to match the compression of common video VAEs such as Wan2.2.
T2V MSE over 0–68K steps (left) and 40K–68K (right).
TakeawayCompression ranges from 1,024 to 4,096 pixels per video token; stronger compression makes video generation harder to learn.
F4
Pixel-space vs. VAE-space training
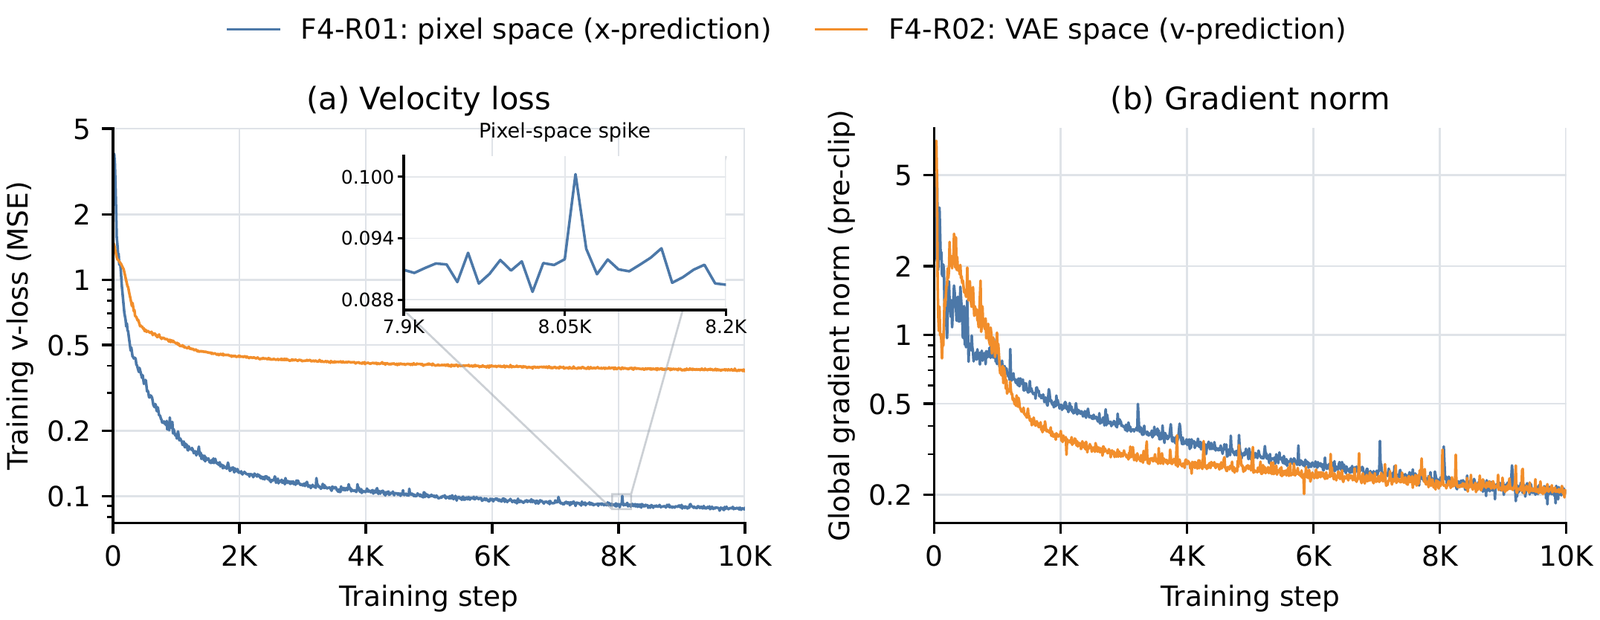
A 32×32 pixel-patch run with x-prediction (F4-R01) against a frozen Wan2.2 VAE with 2×2 latent patchification and v-prediction (F4-R02), at the same effective token stride. At 10K steps the VAE-space loss is about 4.3× the pixel-space loss, but because the two losses live in different spaces, this does not show that pixel space learns faster.
Left: T2I velocity MSE in pixel and VAE space. Right: pre-clip global gradient norm.
TakeawayGradient norms are nearly equal; pixel-space training shows occasional loss spikes.
F5
Model size
1.7B (F5-R01) and 8B (F5-R02) models with the same recipe and a global batch size of 256. The 8B model reaches MSE 0.060 at about 14K instead of 40K steps, and CE 0.50 at about 10K instead of 31K steps.
Joint Stage 1 MSE (left) and CE (right).
TakeawayThe 8B model reaches comparable generation and text losses in roughly one third of the training steps.
F6
Compute scaling
The same 1.7B model and matched recipe on 8 GPUs (F6-R01) versus 128 GPUs (F6-R02). With more GPUs, CE reaches 1.0 at about 2K instead of 17.5K steps (≈9× fewer), while MSE reaches 0.065 at about 17K instead of 23K steps (≈1.3× fewer). These are steps to a fixed loss, not wall-clock speedups.
MSE (left) and CE (right); opaque curves are EMAs of the raw measurements.
TakeawayMore GPUs speed up text (CE) convergence far more than generation (MSE) convergence.
F7
Multimodal context conditioning
Clean conditions (text, reference images, an input video) enter the understanding expert, noisy target tokens enter the generation expert, and both meet in shared self-attention. This extends SenseNova-U1’s encoder-free image conditioning to image-to-video and video editing, with no separate VAE-token stream. After 15K steps of multi-task fine-tuning on eight tasks, image understanding moves both ways (BLINK +2.37, CV-Bench +2.27, SEED-I −5.41), while all four video benchmarks improve by 0.89–3.49 points.
Interleaved visual-context conditioning.Image-to-video: the clean first frame, then frames 0, 47 and 95 of the generated clip.
TakeawayClean visual conditions can be routed through the understanding expert without systematically degrading understanding.
F8
Video understanding interfaces
dense_mode samples at 4 FPS and forms 4-frame tubelets; sparse_mode samples at 1 FPS and projects frames independently. Both use the same 448² per-frame budget. At F8-R01 (Und Stage 3, 9K steps):
Interface
MVBench
Video-MME
LongVideoBench
LVBench
sparse_mode
71.15
57.89
59.39
41.38
dense_mode
71.22
57.67
58.71
41.38
Δ
+0.07
−0.22
−0.68
0.00
Takeaway4-FPS tubelet input performs comparably to 1-FPS frame input.
Understanding benchmarks
The released PixelUMM checkpoint, compared with unified models and vision-language models (VLMs). Its overall performance is comparable to the baselines. Since training data differ across models, these results cannot establish which architecture is superior or which model converges faster. Dark and light green mark the best and second-best result in each row.
Image understanding
Unified models
VLMs
Benchmark
PixelUMM8B MoT
BAGEL7B MoT
TUNA7B+5B
TUNA-27B+5B
Qwen2.5-VL7B
LLaVA-OV-1.58B
LLaVA-OV-28B
Qwen3-VL-Inst.8B
NEO-ov8B
MMMU
41.67
55.30
49.80
50.70
51.30
55.40
–
69.60
68.10
MMStar
53.99
–
61.20
–
62.50
67.70
64.30
70.90
67.30
RWQA
71.63
72.80
66.10
67.70
68.50
68.10
69.70
71.50
67.80
SEED-I
70.39
–
74.70
–
77.50
77.30
–
–
76.60
AI2D
80.12
89.20
79.30
79.60
82.60
84.20
84.30
85.70
85.40
DocVQA
90.42
–
–
–
94.90
95.00
95.20
96.10
91.90
ChartQA
82.96
78.50
85.80
85.60
84.10
86.50
85.90
89.60
86.20
InfoVQA
63.67
–
–
–
81.70
78.40
74.40
83.10
–
TextVQA
78.76
–
–
–
84.90
–
–
–
78.50
OCRBench
78.00
73.30
74.30
79.70
84.20
82.90
78.20
89.60
81.60
MME
1809.54
2388.00
–
–
2347.00
–
–
–
–
GQA
61.90
66.40
63.90
65.00
60.70
–
–
–
–
MMVP
80.33
85.00
70.70
77.30
78.00
–
–
–
–
SEED2+
64.51
71.90
52.70
61.10
70.90
69.20
–
–
–
CV-Bench
77.60
–
–
–
80.00
80.70
–
–
–
CountBench
94.30
82.50
73.50
81.70
86.40
88.20
89.00
89.80
–
PixMo-Count
73.03
–
–
–
63.30
62.20
64.00
62.40
–
V*
76.96
70.20
52.40
59.20
77.00
78.00
85.90
85.30
–
MMMU-Pro
27.63
–
–
–
36.30
37.40
–
–
–
BLINK
53.46
–
–
–
56.40
48.30
63.50
69.10
62.80
MuirBench
38.31
–
–
–
59.60
–
–
64.40
58.20
PixelUMM is evaluated with the official LMMS-Eval protocol (64,750 generations over 21 tasks).
Video understanding
Unified models
VLMs
Benchmark
PixelUMM8B MoT
Show-o21.5B+0.5B
TUNA1.5B+?
Lance3B MoT
LLaVA-OV-28B
Qwen3-VL8B
Keye-VL-1.58B
InternVL-3.58B
PLM8B
LLaVA-OV-1.58B
MVBench
70.53
49.80
54.40
62.00
66.20
69.00
56.90
72.10
77.10
51.20
Video-MME (w/o sub.)
57.33
48.00
49.10
–
71.90
71.40
73.00
65.90
60.50
61.10
LongVideoBench
59.61
49.20
49.70
–
66.90
68.00
66.00
62.40
59.60
56.20
LVBench
40.41
–
27.40
–
55.50
58.00
42.80
46.70
44.50
40.10
PixelUMM is evaluated in sparse_mode with up to 96 sampled frames. Video-MME is evaluated without subtitles. Published models keep their original evaluation protocols.
Limitations
PixelUMM has weaknesses. Generating directly in pixel space removes the VAE, but PixelUMM still shares the typical failure modes of latent video diffusion models.
Many similar entities. When several animals or people overlap, their bodies can merge, split, or appear out of nowhere, so their number drifts over the clip.
Hands and fine anatomy. Hands can have the wrong number of fingers, and small limbs can blur into each other.
Physics and interactions. Motion can be physically implausible, rigid objects can bend or morph, and interactions between objects or characters may not have the expected effect.